Gaining an insight into the keywords which deliver organic visitors to a website is key to understanding current performance and helping to determine future strategic actions. Furthermore the breakdown between the proportion of branded and non-branded keywords which delivered traffic to a website is a key performance indicator.
Unfortunately since 2010 following Google’s decision to no longer capture keyword referral data on privacy grounds, gaining access to such information has become a more complex task. Fortunately while organic keyword referral data is no longer available in Google Analytics there are a variety of workarounds, to help plug this gap in insight. The second best source for this data in my opinion is Google Search Console (GSC). Over the past couple of years the reporting of performance data (keyword clicks, impressions, CTR and average position) within GSC has become much more comprehensive with a greater sample size of data reported.
In this post I’m going to show a method to dynamically estimate and visualise brand vs. non-brand traffic (sessions) to a website within Google Data Studio (GDS) utilising performance data from GSC applied to actual traffic data from Google Analytics (GA).
Why Estimate Brand Vs. Non-brand
Review of performance – SEO strategies are most commonly targeted towards increasing the visibility of a website for non-brand keywords. A significant ramp up in above the line marketing activity may result in an uplift in branded organic traffic. This increase in branded traffic may provide a false indicator of overall organic performance if it is not correctly identified and segmented.
Brand performance – Mirroring the importance of monitoring non-brand traffic volumes, it is key to report offline / branded marketing activity to ensure it is not undervalued as a result of increasing SEO activity.
Impact of updates – If a website receives a high volume of branded organic traffic then it can be increasingly difficult to identify algorithm changes or penalties which may have impacted orgaic visibility.
Forecasting – Lastly without the effective segmentation of brand vs. non-brand traffic it becomes increasingly difficult to accurately forecast future organic traffic patterns.
Step 1 – Add GA and GSC Data Sources
First we must connect GA and GSC to our GDS report. For the GA data source simply choose the required Account, Property and View. When adding the GSC data source select the required site and select ‘Site Impression’ as the table type.
Step 2 – Create Blended Data View
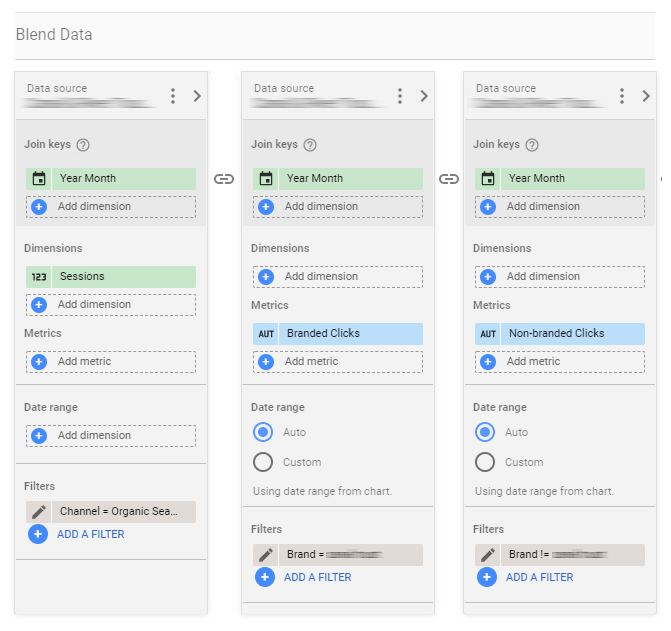
Once the above data sources have been successfully connected to your report, the next step is to create a blended data view. This blended data view will contain a total of 3 separate data sources:
- Google Analytics
- Google Search Console (filtered to brand traffic only)
- Google Search Console (filtered to non-brand traffic only)
The join key for the blended data view across all data sources should be set as ‘Date’. I typically set the date granularity to monthly but it could be set to weekly or daily if required.
To configure your GA data source, first add ‘Sessions’ as a metric. Note no dimensions are required beyond that of ‘Date’ defined within the join key. Next create a filter / apply a segment to ensure only organic traffic is captured.
Progressing on to the GSC data sources, add ‘Clicks’ as a metric to both. The first GSC data source will capture non-brand performance data, while the second will capture branded performance data. To ensure these can be distinguished easily post blend, rename the respective ‘Click’ fields accordingly.
For each respective GSC data source a filter is required to include / exclude branded clicks. To ensure all brand variants are captured by the respective filter, a ‘RegExp Contains’ will likely yield the best results.
Lasty ensure to provide your new blended data view with a logical name, i.e. ‘Blended brand vs. non-brand traffic’.
Step 3 – Create chart
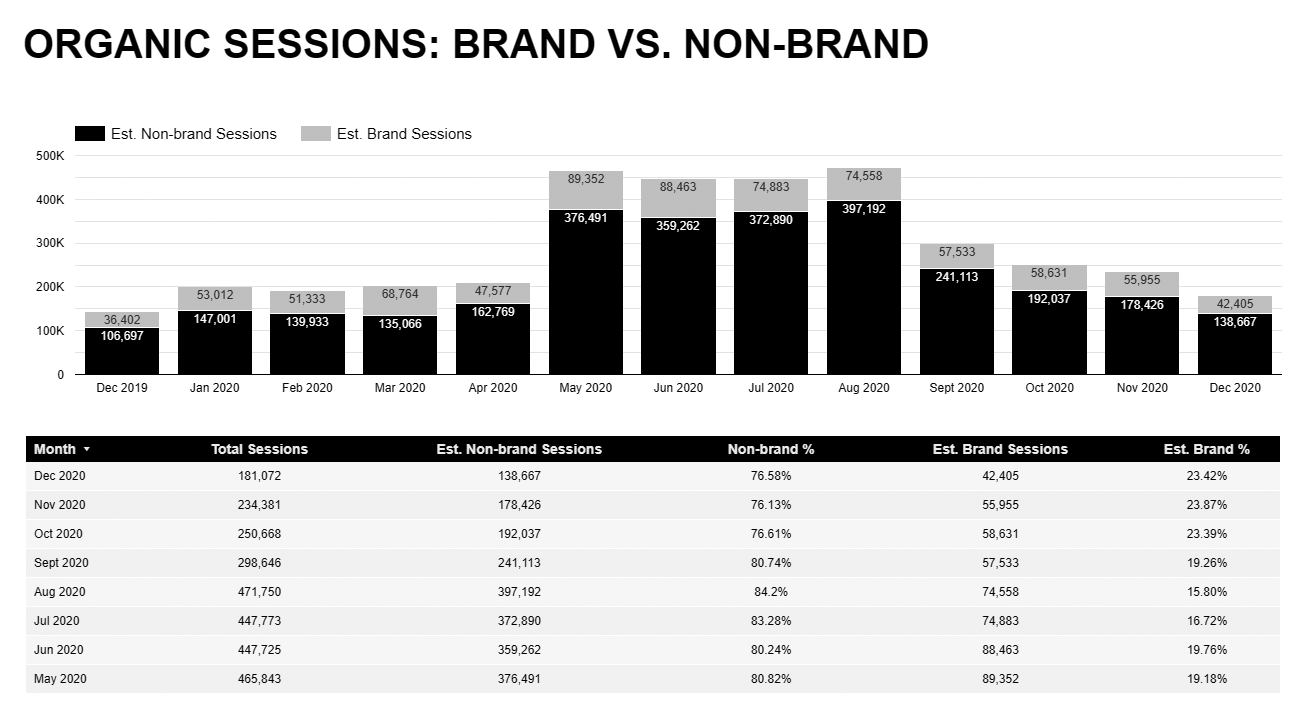
To visually display the breakdown of brand vs. non-brand traffic I typically utilise a stacked column chart with data labels enabled. This chart type allows for both the overall traffic trend to be displayed but also the breakdown of estimated brand vs. non-brand sessions across each month.

To use this visualisation, click to add a stacked column char from the list of available chart types. Ensure the data source for your newly inserted chart is set to the previously created blended data view.
The first configuration for the chart should be the specification of the dimension to be the specified date parameter (month in the case of this guide).
In order to dynamically calculate the estimated number of brand vs. non-brand sessions, a calculated field is required for each. These fields calculate the estimated percentage of each traffic type and extrapolate it out from the total number of recorded organic sessions:
Est. Brand Sessions
Finally set the date range to include the previous 13, allowing for both MoM and YoY comparisons to be observed.
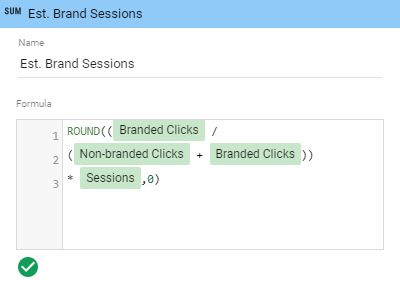
ROUND((Branded Clicks/(Non-branded Clicks+Branded Clicks))*Sessions,0)
Est. Non-brand Sessions
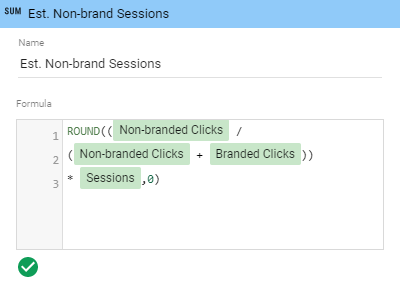
ROUND((Non-branded Clicks/(Non-branded Clicks+Branded Clicks))*Sessions,0)
Step 4 – Create table
To compliment the above visualisation I like to also present the data in a tabular format, allowing for supplementary data and context to be shown / available to download.

To add the above table, once again select Date (Month) as the dimension and add the following metrics:
Total Sessions – Organic sessions field from GA data source
Est. Brand Sessions

ROUND((Branded Clicks/(Non-branded Clicks+Branded Clicks))*Sessions,0)
Brand %
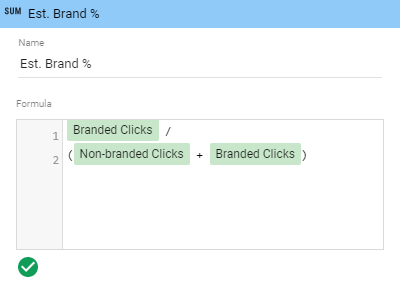
Branded Clicks/(Non-branded Clicks+Branded Clicks)
Est. Non-brand Sessions

ROUND((Non-branded Clicks/(Non-branded Clicks+Branded Clicks))*Sessions,0)
Non-brand %
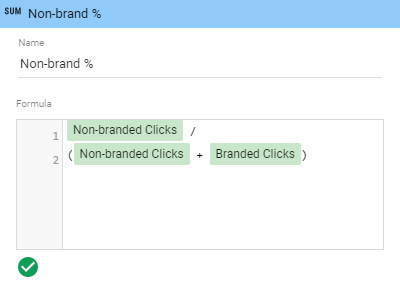
Non-branded Clicks/(Non-branded Clicks+Branded Clicks)
The date range of the table should ideally match that which was set in the chart visualisation to maintain data conformity.
Do you currently analyse brand vs. non-brand traffic to the websites you manage? If so do you find these insights valuable? If you are not tracking such insights, do you plan incorporate this analysis into your reporting moving forwards, let me know in the comments below.
Hey Chris, thanks for this wonderful post, really insightful, tried this out, one quick question. how much difference would you see in the brand% vs non-brand%, if you compare it to just data from GSC brand vs non-brand report.
Hi, I think I’m interpreting your question correctly but please let me know if not. The variance between brand% and non-brand% within this post will mirror that in GSC. As we are calculating the respective % splits based on GSC click data then extrapolating this onto actual traffic data from Google Analytics.
Thanks, Chris. I was actually set up some things wrong, but tried the same dashboard using GSC-API with data in BQ, and works smoothly. Thank you for this wee solution
thank you for this great content.